Digitizing our Gas Meter
The goal of this project was to be able to display the gas consumption of our house on our kitchen dashboard in order to get a better overview of the costs incurred and to explore the potential for savings.
The basic idea was to use a magnetic switch sensor (Reed-sensor) to read impulses from our gas meter. This sensor should forward the impulses to an ESP32 running Tasmota, which then increments a counter and forwards the data to my home automation server, which is an ioBroker instance running on a Raspberry Pi.
Placing the sensor
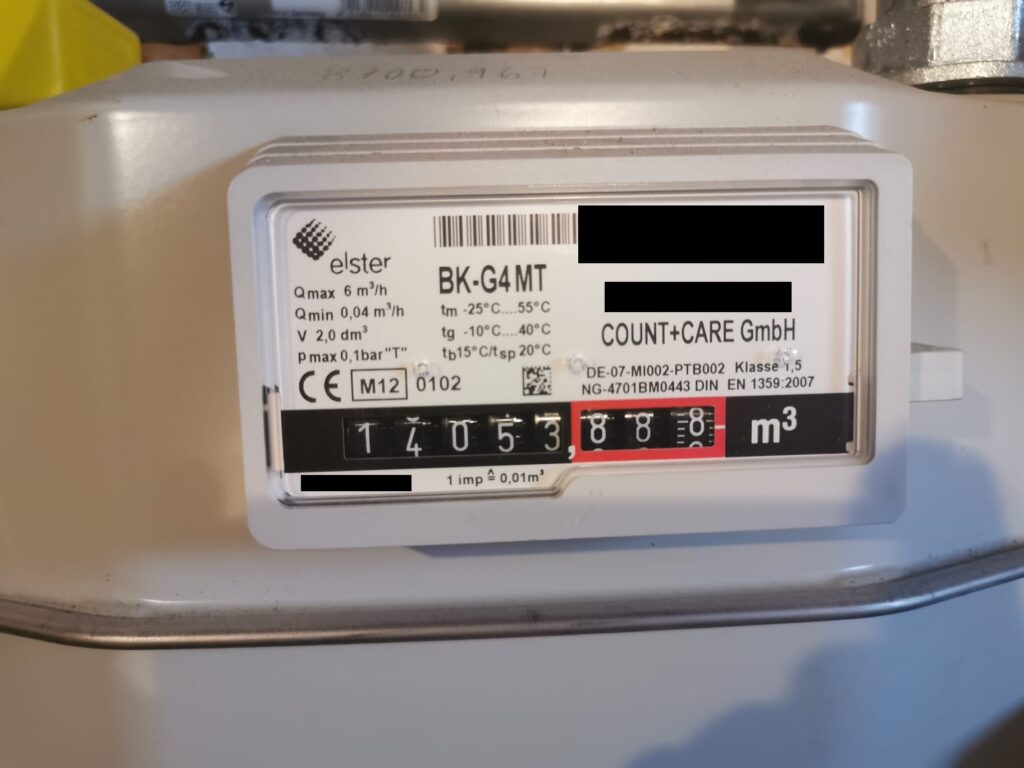
We have a BK-G4 MT type gas meter in our basement, which has been there for a few years and does not have any sort of digital or optical outputs. The only interface it has is a magnetic one. Below the display there is a small opening where a magnetic sensor can be placed. It works as follows: each time the wheel on the right reads the number zero, the magnet on the wheel is located right above the opening, making it possible to read the impulses with a magnetic sensor.
I’m using a KY-025 magnetic switch (amazon), which only costs a few Euros and has been working very well for this use case. It has two LEDs, one showing it has power and the other signaling it has detected a magnetic field.
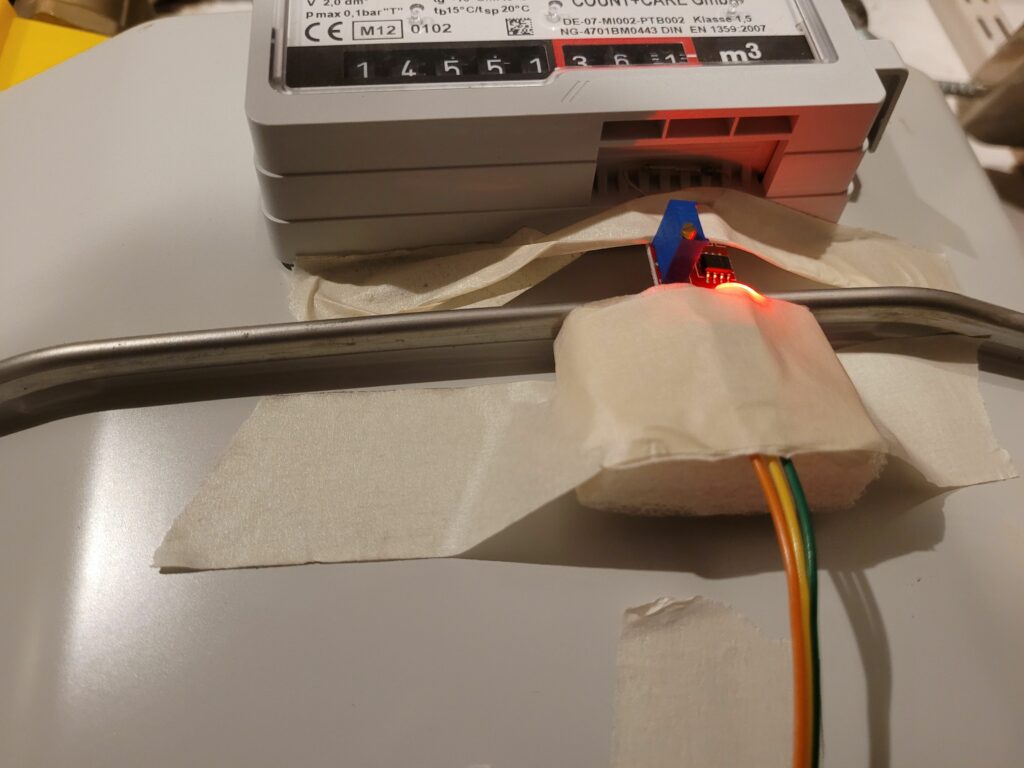
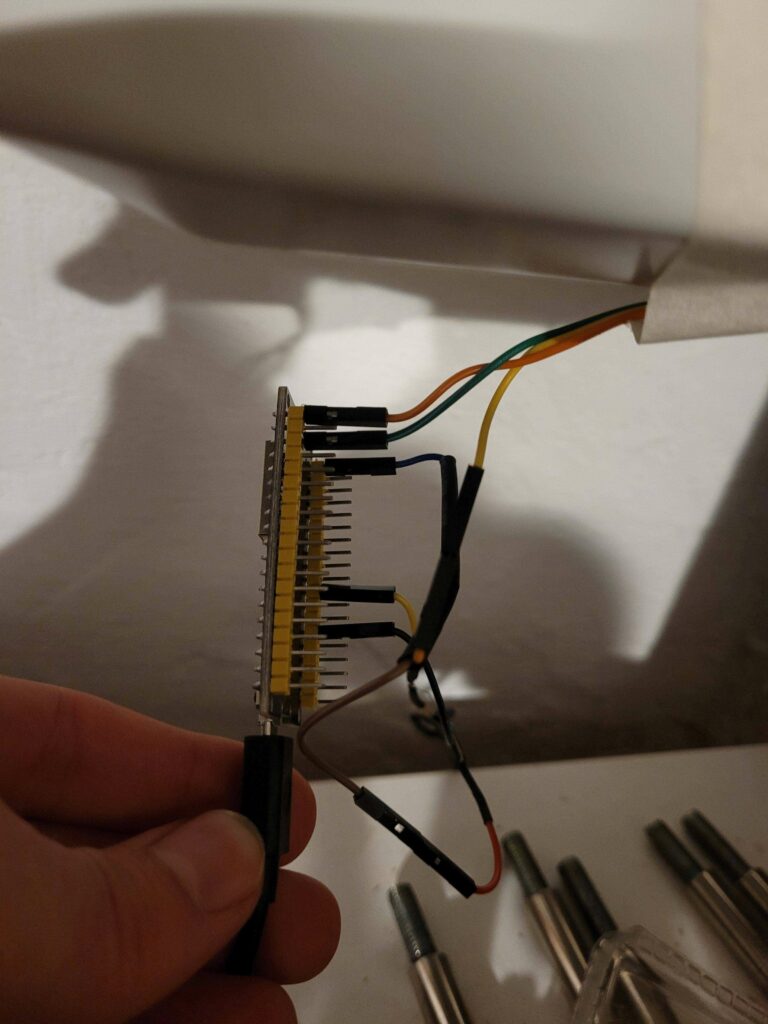
The sensor is fixed to the gas meter, the sensor part needs to be placed completely in the opening. I used some painter’s masking tape and a piece of styrofoam to keep it in place. I then connected it to the previously flashed ESP32 on VCC, Ground and a GPIO Pin.
Configuring the ESP32 / Flashing Tasmota
The easiest way to configure the ESP32 without any coding is by installing the open-source software Tasmota. This is done by connecting the ESP32 to a PC and using the Tasmota Web Installer which automatically flashes the software and lets you configure the Wifi. The ESP then receives an IP address from the Router’s DHCP. This address needs to be saved to allow further configuration down the road.
Once the wiring was completed and the ESP was reachable from my PC, I configured GPIO22 as a Counter and entered the MQTT credentials of my ioBroker account.
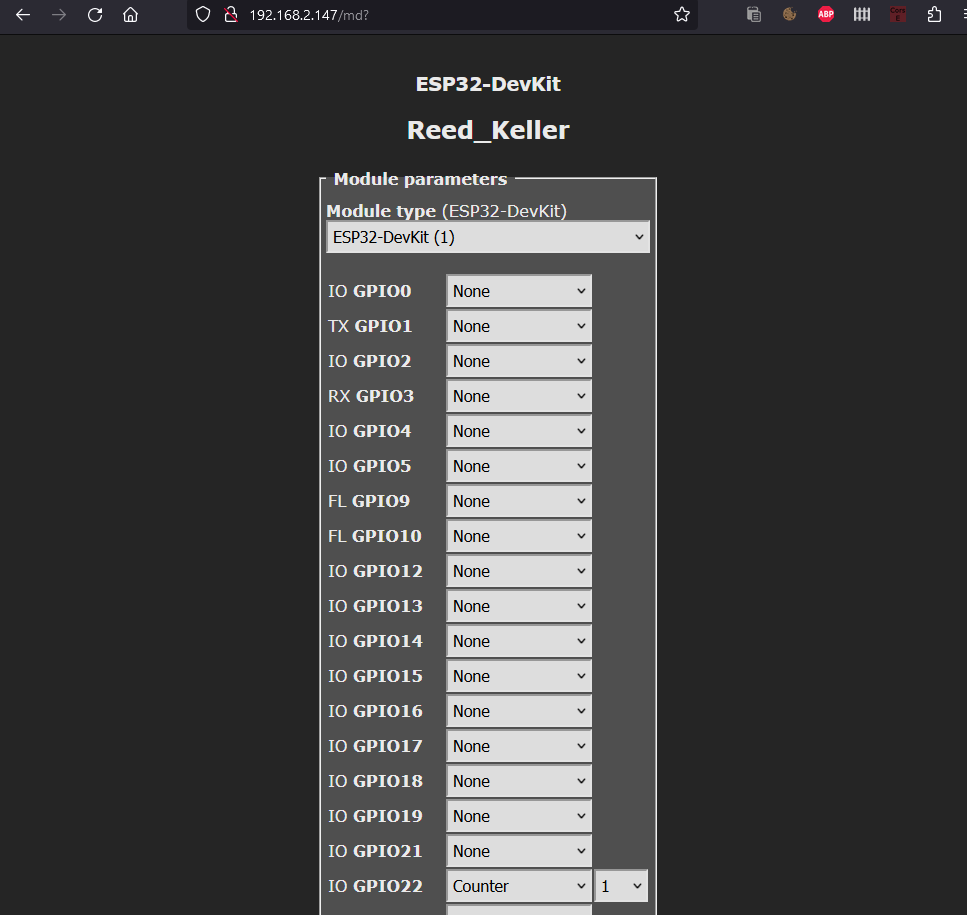
The web interface then shows the current count of the counter. I needed to adjust the magnetic sensor’s sensitivity a few times using a small screwdriver until every impulse was correctly recognized. The counter in the web interface should count up every time the last wheel of the gas counter passes zero. This can be quite a hassle, but once it works it works.
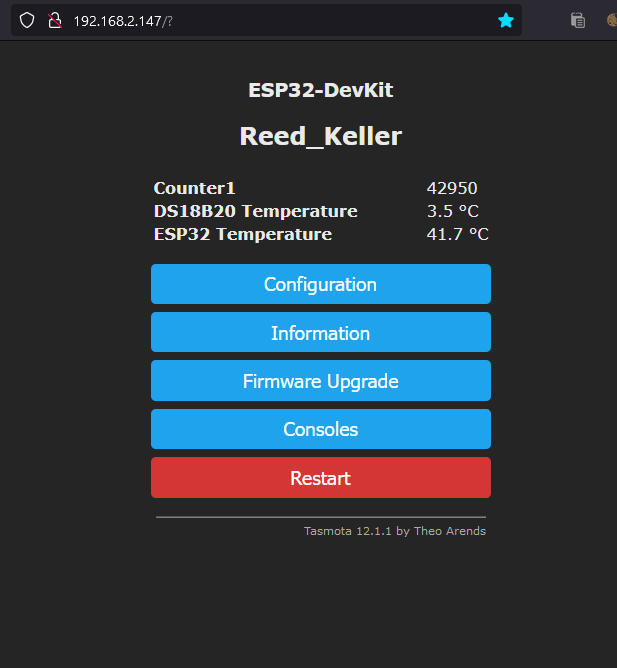
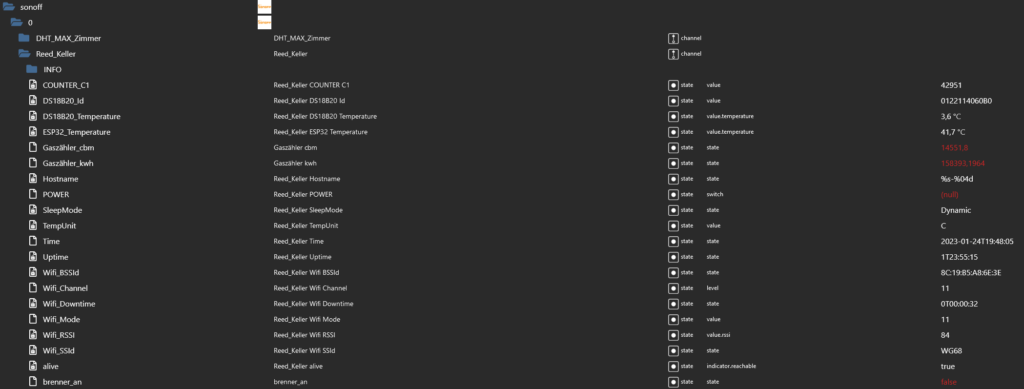
Each time the counter increments, it publishes the new value via MQTT. It then shows up in my ioBroker web interface.
Configuring ioBroker
In order to get the current gas meter value in cubic meters, I coded a few lines of JS to convert the counter increments. I also convert the cubic meters to kWh, to be able to more easily track the daily consumption:
on({id: 'sonoff.0.Reed_Keller.COUNTER_C1', change: 'gt'}, function (obj) {

  const cbm = getState('sonoff.0.Reed_Keller.Gaszähler_cbm').val;
  const cbm_new = +(cbm + (0.01)).toFixed(2);
  setState("sonoff.0.Reed_Keller.Gaszähler_cbm", cbm_new);

  const kwh_new = cbm_new * 11.015);
  setState("sonoff.0.Reed_Keller.Gaszähler_kwh", kwh_new);
});
The code works as follows: each time a new value is received for the counter, which is greater than the previous value (‘gt’), 0.01 cubic meters are added to the cubic meter counter. To convert to kWh, the cubic meters need to be multiplied with the correct factor, which can vary by region and over time and can be found in the most recent gas bill. Of course, these counters need to be initialized once with the current meter reading.
To make my life easier, I use the SourceAnalytix adapter for ioBroker, which lets you enter your utility prices and easily tracks daily consumption which can then be stored using the history adapter.
Data Evaluation
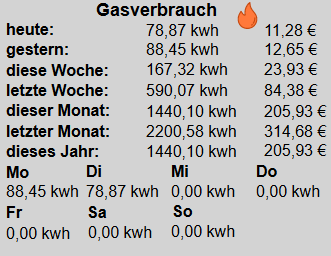
Using the ioBroker adapter “vis”, I created a very simple widget displaying the cost and consumption of gas for the current day/week/month/year and the week/month/year before. I integrated this widget into our kitchen dashboard. The orange flame shows if there has been a counter increment in the last 90 seconds, signalling that the heating system is currently in operation and burning gas.
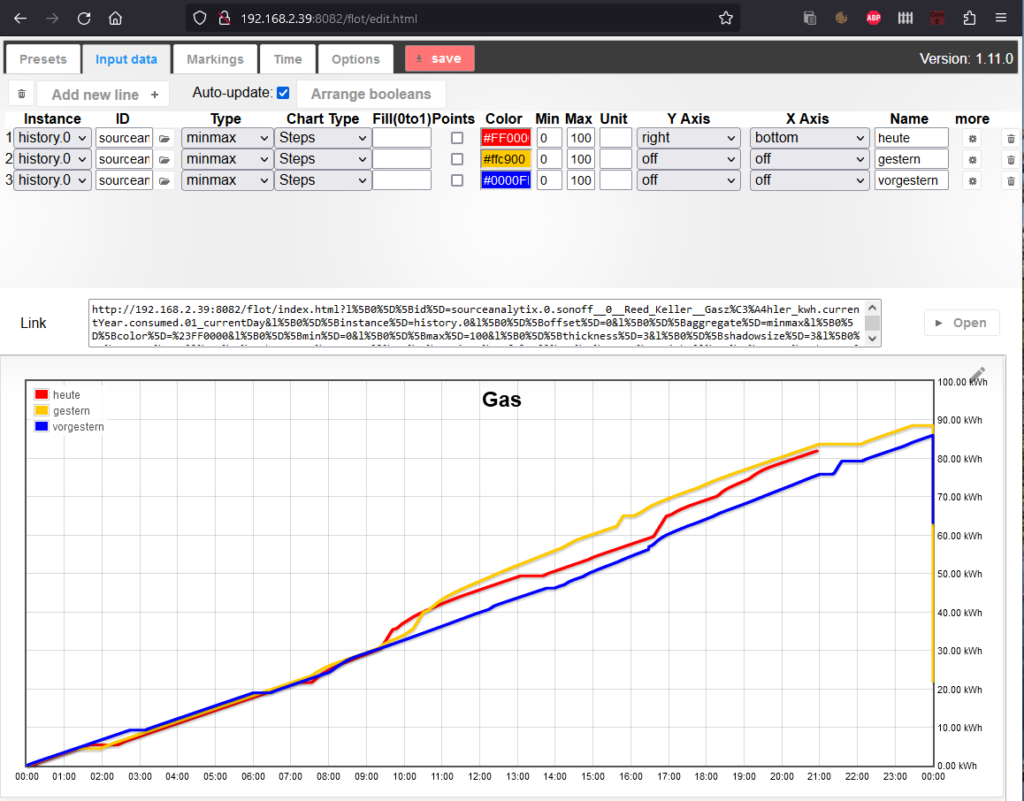
For graphing data, I use the “Flot” adapter for ioBroker, which lets you create all sorts of graphs from data stored in the history adapter.
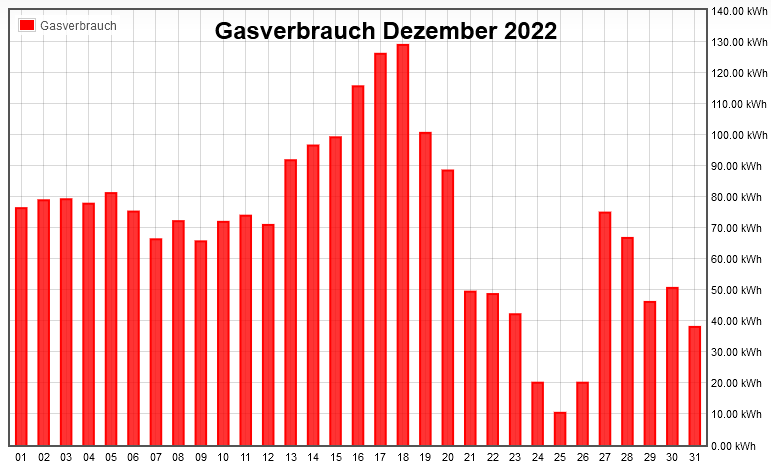
The following graph shows our gas consumption in December 2022. Consumption varies greatly depending on the temperature. During the third week, it was -10°C outside, before it became significantly warmer and everybody went to their families for Christmas.
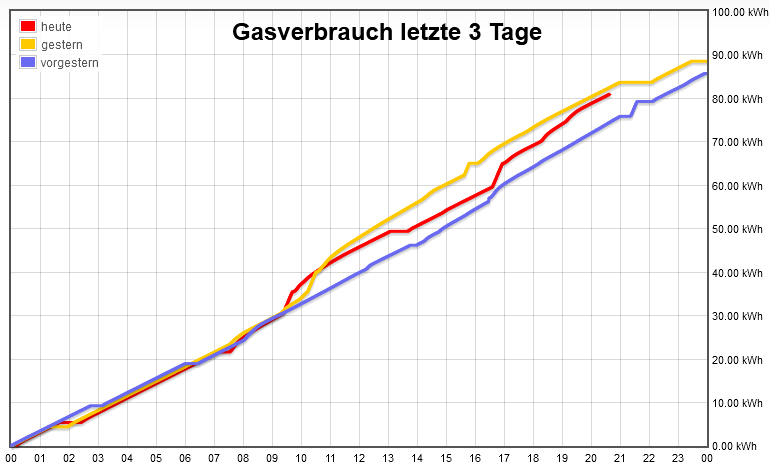
My favorite graph is the one showing the details of the gas consumption of the last three days (shown below). It updates every 10 seconds and therefore always has the latest data. It’s interesting to see when the warm water tank is heated, which is when the curve is extremely steep for about 5-20 minutes. This usually happens after someone takes a shower. Using a simple algorithm, it would be possible to completely separate the gas usage for heating and warm water and look at them both independently.
Regarding the accuracy of the magnetic sensor, I must say it does make some occasional errors, when it skips a rotation it should have counted. This happens every few days. Since I have not figured out in which situations this happens exactly and it’s not worth the effort, I just correct the meter value in ioBroker about once a month. The blue curve in the graph, at about 4:30 pm shows such a manual correction. This inaccuracy, however, is way below 1% since there are hundreds of counts everyday and is therefore negligible.

Given these results, the digitization of our gas meter has been a full success, costing me only about 10 Euros for the ESP32 and the magnetic sensor.